
1000 Sales record of Amazon online
The purpose of the analysis is to show the board regions with the best sales channel and total revenue of the company to make future decision on workforce and adjustments.

I love tech;
the Lord is my sheperd

I love to querying, building, manipulating and analyzing data models that solves problems.
You can visit my linkedln page here.
My Frontend developer movement involves Html, CSS, Javascript
My Datastack tools, MS Excel, Power BI, Tableau, Python, SQL, API.
For my Geomatics stack,AutoCAD, ArcGIS, Civil3D, ArcMap, Google Earth, Agisoft, Global Mapper, Trimble Business center and few others. While equipment used,Drone, Level, GPS, Total Station and Ecosounder.
These are some of my most interesting projects.
The purpose of the analysis is to show the board regions with the best sales channel and total revenue of the company to make future decision on workforce and adjustments.
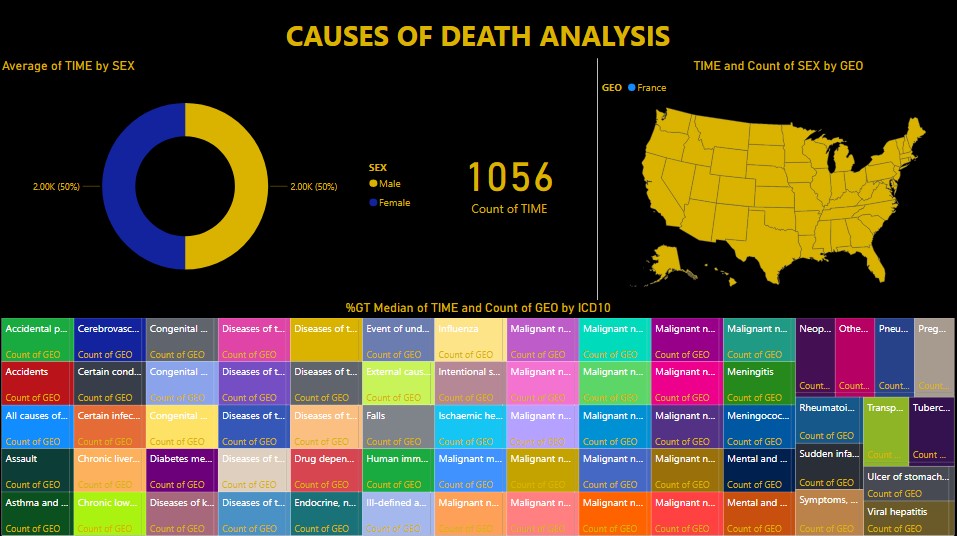
This is a storytelling data about deaths rate and which gender in which region and how many number of people died along with which city in France
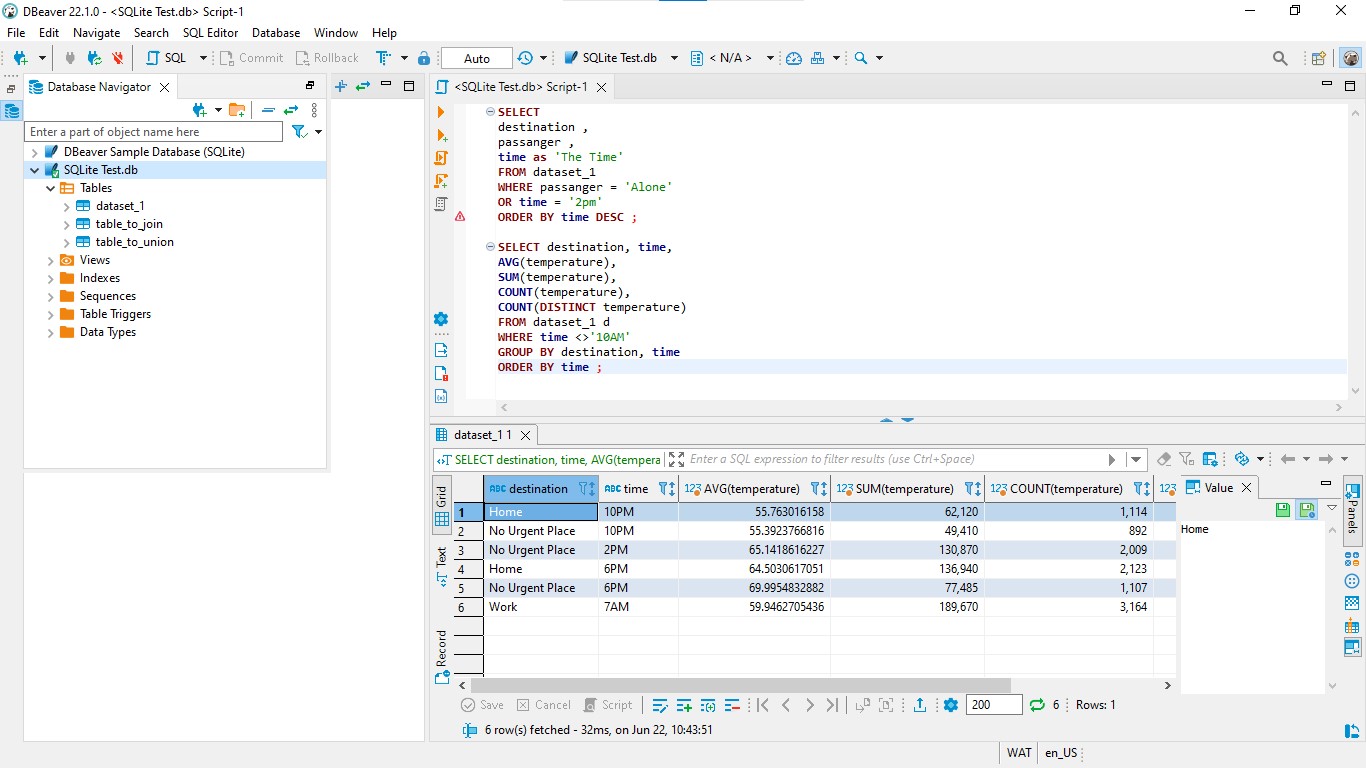
Abstracting certain queries for a transport company to know destination, passanger and what time in distinct count.